
In Times of Crisis, Recovery Rates Matter a Lot
In our last QuickTake, “Not All Private Credit Is Created Equal,” we compared Asset-Based Lending and Cash Flow Lending. The purpose of the piece was to bring attention to the different underwriting features of these two lending styles and how they may perform in a difficult credit market.
Share
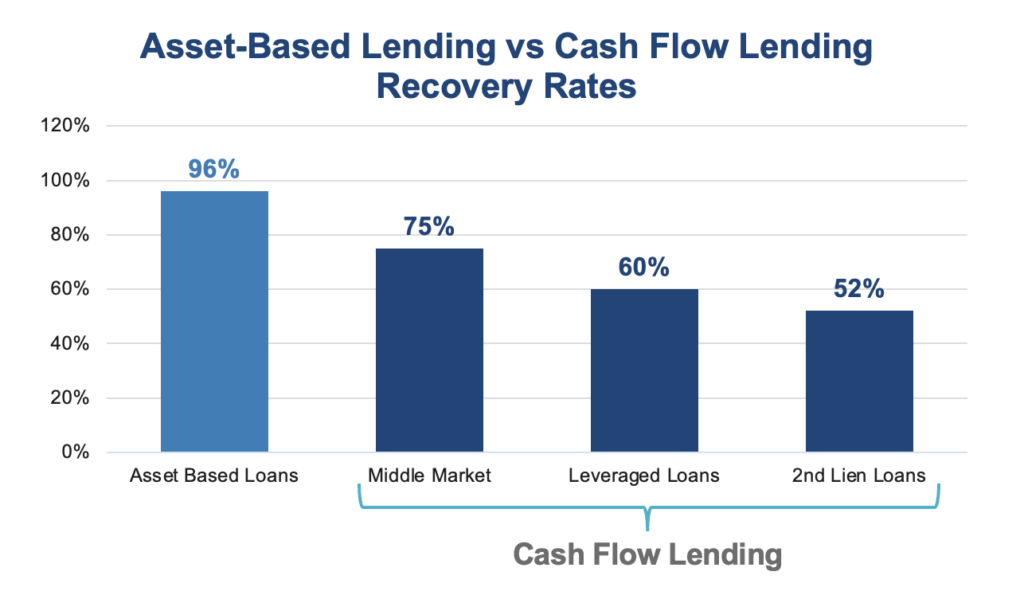
One exhibit in that piece caught the attention of many: the differences in recovery rates across the spectrum of credit—as shown below. What we didn’t do in that paper was unpack what these different recovery rates mean in terms of differences in returns for investors.
In this brief QuickTake, we quantify how different recovery rates affect total returns during a heightened default rate environment. The key finding is that in times of crisis, recovery rates have a major impact on overall return.
In this brief QuickTake, we quantify how different recovery rates affect total returns during a heightened default rate environment. The key finding is that in times of crisis, recovery rates have a major impact on overall return.
Analysis
[1] In addition to the assumptions on default and recovery rates, we also assume a 20% initial default discount. See the methodology section for more detail.
In benign default environments, recovery rates don’t affect returns significantly.
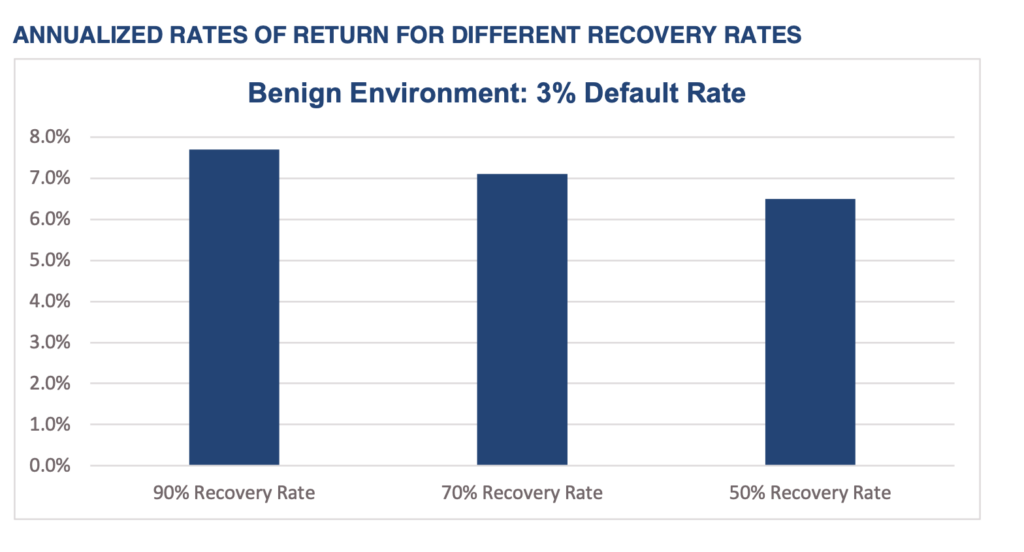
The fact that recovery rates matter more in crisis environments is not a blinding new insight. Our analysis above simply provides additional intuition as to the magnitude of the impact.
Conclusion
We have observed that many investors are hyper-focused on the risk of default in credit markets, but recovery rates are often viewed as a second-order concern. Our analysis suggests that this is perfectly reasonable when credit markets are not in distress.
However, during potential periods of credit distress, we believe fixed income investors would be well advised to pay as much attention to recovery rates as default rates, especially as the economic outlook continues to darken.
Methodology
We performed a Monte Carlo simulation, since there is some return dependence upon when loans are defaulting in the simulation period. Our model portfolio is composed of an equally weighted portfolio of 100 loans, with the following assumptions.
Portfolio Yield (PY)—The yield of each loan is 8%.
Maturity (M)—The maturity of each loan is three years.
Recovery Rate (RR)—The expected recovery on any loan that has defaulted.
Default Rate (DR)—The annual default rate of the portfolio. If the default rate is 12%, that means there is a 1% chance a given loan will default in a given month.
Number of Years of Analysis (NA)—The number of years over which the simulation is calculated. We assume the loans mature at the end of the analysis period.
Initial Default Discount (IDD)—When a loan defaults, we assume its value falls 20% past its eventual recovery rate, which is what typically occurs in the real world. For example, if the ultimate recovery is 80%, we assume the bond falls to 60% immediately upon default.
Years in Default (ND)—In this model we accrete a defaulted loan’s price between the IDD and RR (between 60% and 80% in the above example). This mimics our observation of the real world, in which a defaulted loan value initially declines upon default and gradually creeps up to the eventual recovery rate over time.
Number of Scenarios (NS)—We ran our simulation over 250 independent scenarios. The outputs utilized in this analysis are the average returns over those scenarios.
Disclosures
Past performance does not guarantee future results. Index performance is not indicative of fund performance. To obtain fund performance click here.
Investors should carefully consider the Fund’s investment objectives, risks, charges, and expenses before investing. This information is included in the Fund Prospectus and a copy may be obtained by calling 800-452-6804 or by contacting us here. Read the prospectus carefully before you invest.
An investment in the Fund involves a high degree of risk. An investment in the Fund should be viewed only as part of an overall investment program and you should invest only if you can sustain a complete loss of your principal. Please read the prospectus carefully. An investment in the Fund is subject to, among others, the following risks:
The Fund is not intended as a complete investment program but rather the Fund is designed to help investors diversify into private credit investments.
The Fund is a “nondiversified” management investment company registered under the Investment Company Act of 1940. Since the Fund is non-diversified, it is subject to higher reduction of capital and volatility than a fund more proportionately allocated among a large number of securities.
An investment in the Fund involves risk. The Fund is new with no significant operating history by which to evaluate its potential performance. There can be no assurance that the Fund’s strategy will be successful.
The Fund may use leverage its investments by “borrowing.” The use of leverage increases both risk of loss and profit potential. The Fund is subject to large shareholder transaction risks which may cause the Fund to sell portfolio securities at times when it would not otherwise do to so satisfy large shareholder redemptions.
Shares of the Fund are not listed on any securities exchange and it is not anticipated that a secondary market for shares will develop. Shares are appropriate only for those investors who can tolerate a high degree of risk, do not require a liquid investment.
There is no assurance that you will be able to tender your shares when or in the amount that you desire. Although the Fund will offer quarterly liquidity through a quarterly repurchase process, an investor may not be able to sell or otherwise liquidate all their shares tendered during a quarterly repurchase offer.
The Fund’s investment in private credit companies is speculative and involves a high degree of risk, including the risk associated with leverage.
The Fund has an interval fund structure pursuant to which the Fund, subject to applicable law, conducts quarterly repurchase offers for no less than 5% of the Fund’s Shares outstanding at NAV. While the quarterly repurchase offer is expected to be 5%, the amount of each quarterly repurchase offer may be 5% to 25% subject to approval of the Board of Trustees (the “Board” and each of the trustees on the Board, a “Trustee”). It is also possible that a repurchase offer may be oversubscribed, with the result that shareholders may only be able to have a portion of their Shares repurchased. There is no assurance that you will be able to tender your Shares when or in the amount that you desire.